The sidebar's Column Profile panel (⌃⌘7, offered only in the grid) profiles the selected column and follows you as you move between columns. The profile is computed in one pass over the column as a job you can cancel; on a 2,022,947-row column it takes seconds, and the frequency table of a column with a million distinct values lives in scratch space, not memory.
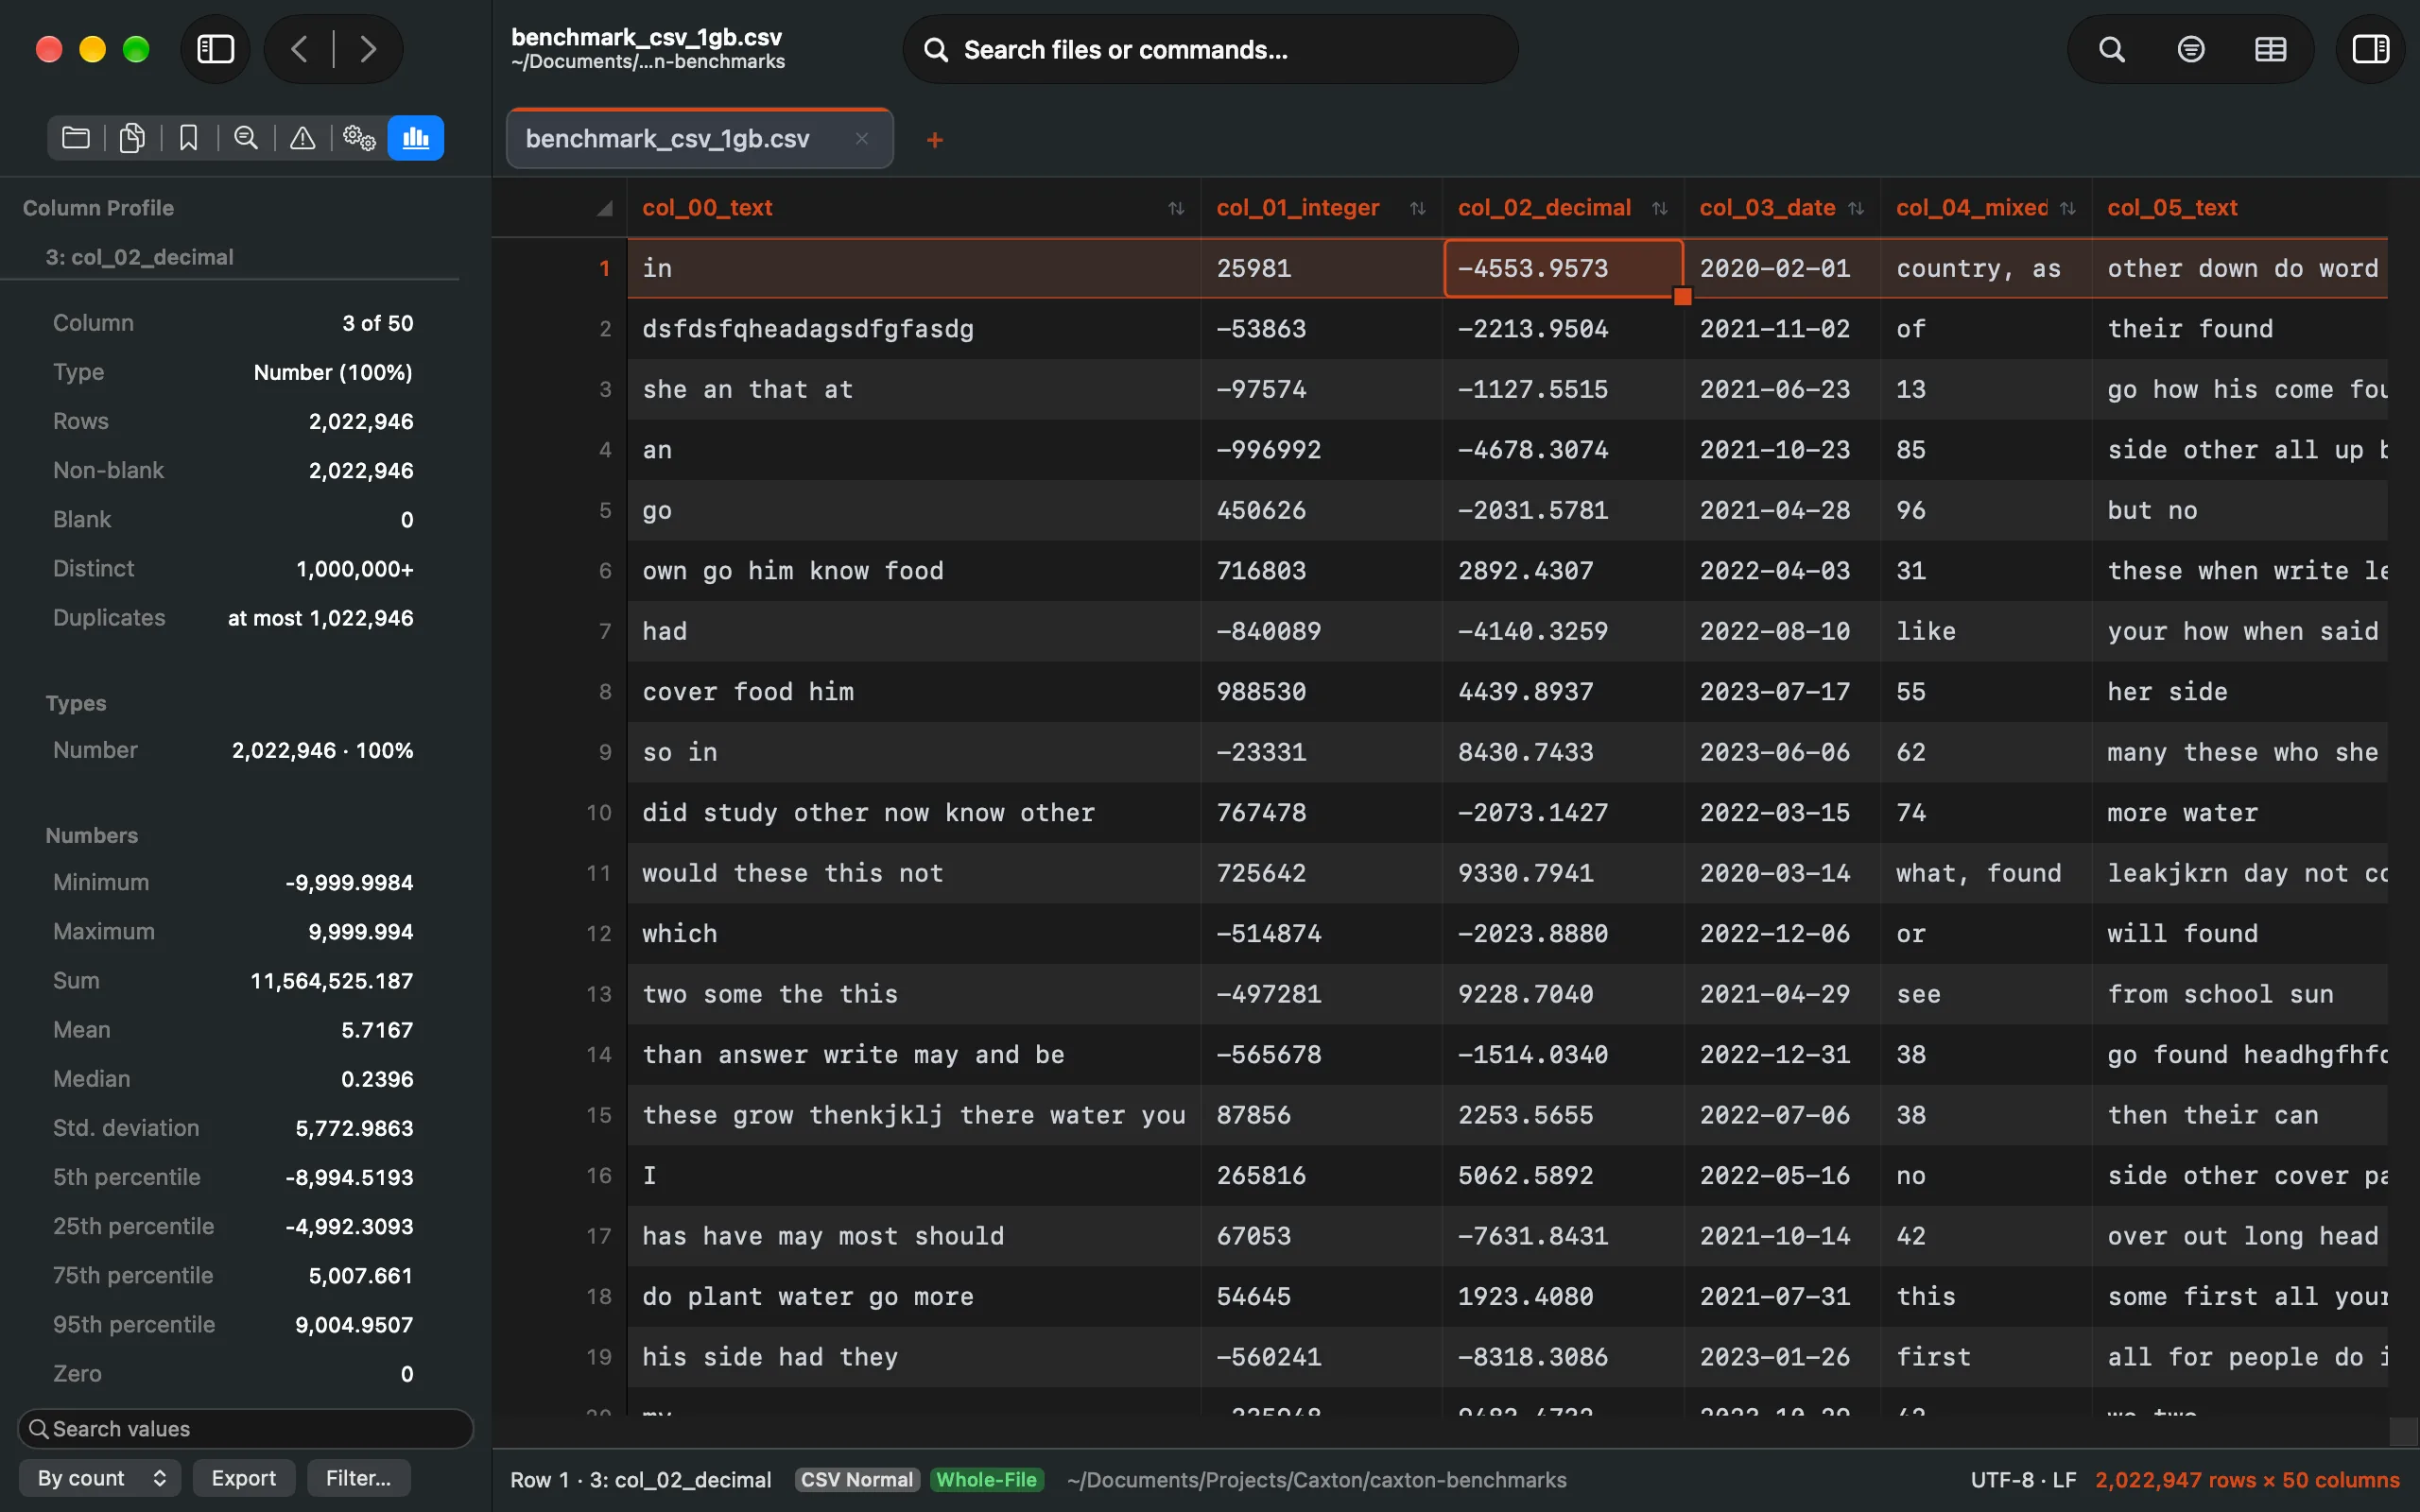
A numeric column's profile: the summary, the types, the numbers, and the values below.
Summary and types
The column's number, its Type (the type most of its values parse as, with that share), rows, non-blank and blank cells, distinct values, duplicates, and null-like values when there are any. Duplicates counts the non-blank values beyond the first of each distinct value, so blank cells never count as duplicates of each other; when the distinct count was capped the figure reads at most. The Types group shows the distribution of what the values parse as (numbers, and of those integers, dates, booleans, text, blanks) with its count and share for each. When some values do not fit the majority type, the panel lists up to eight of them with how often each occurs, wherever they sit in the column, so a stray letter in a numeric column is found in seconds; a column with less than 95% of one type also carries a mixed-types warning.
Numbers
Minimum, maximum, sum, mean, median, the 5th, 25th, 75th and 95th percentiles, the standard deviation, the counts of negative, zero and positive values, and outliers by the interquartile fences: a value is an outlier when it sits more than one and a half times the gap between the 25th and 75th percentiles below the first or above the second, and the row is labelled Outliers (IQR). The median, the percentiles and the outlier count are exact up to four million values and come from a reservoir sample past that; the panel marks those facts as sampled and says how many values the sample held.
Text
The lengths (shortest, longest, mean), values with leading or trailing whitespace, values with non-ASCII characters, values with control characters, and the common prefixes and suffixes.
Dates
The earliest and latest dates, values that are not dates, how many values carry a time zone, and the formats seen (the three most common) with their counts.
Values
Each distinct value with its count, its percentage of the rows and the cumulative percentage, in pages of 200 with Show more. A blank value is named (blank) and a value of spaces only is named by its length, such as (whitespace, 2 characters), instead of showing as an empty row. The search field narrows the table; the popup sorts by count or by value. Export writes the whole table (value, count, percent, cumulative percent) to a new document; Filter… narrows the grid to a value, and a value's menu filters the grid to it or copies it. The table holds up to one million distinct values. A column with more than that shows its Distinct fact with a plus, keeps the first million values in value order, and says so in a line above the list.