Log Mode
A log is a first-class view in Caxton, not only big text: jump by time, filter by severity, note the incident, extract the window around it, and follow a file that grows faster than you can read.
When a file is a log
A file becomes a log by its extension, by a file pattern rule, or by the shape of its first lines. One stamped line is enough on a short file, and a followed file that starts empty is detected as lines arrive. In a log, error and warning lines carry a tinted row band, the minimap shows red and amber ticks for them, the filter bar gains a Severity popup, and Go to Time is available.
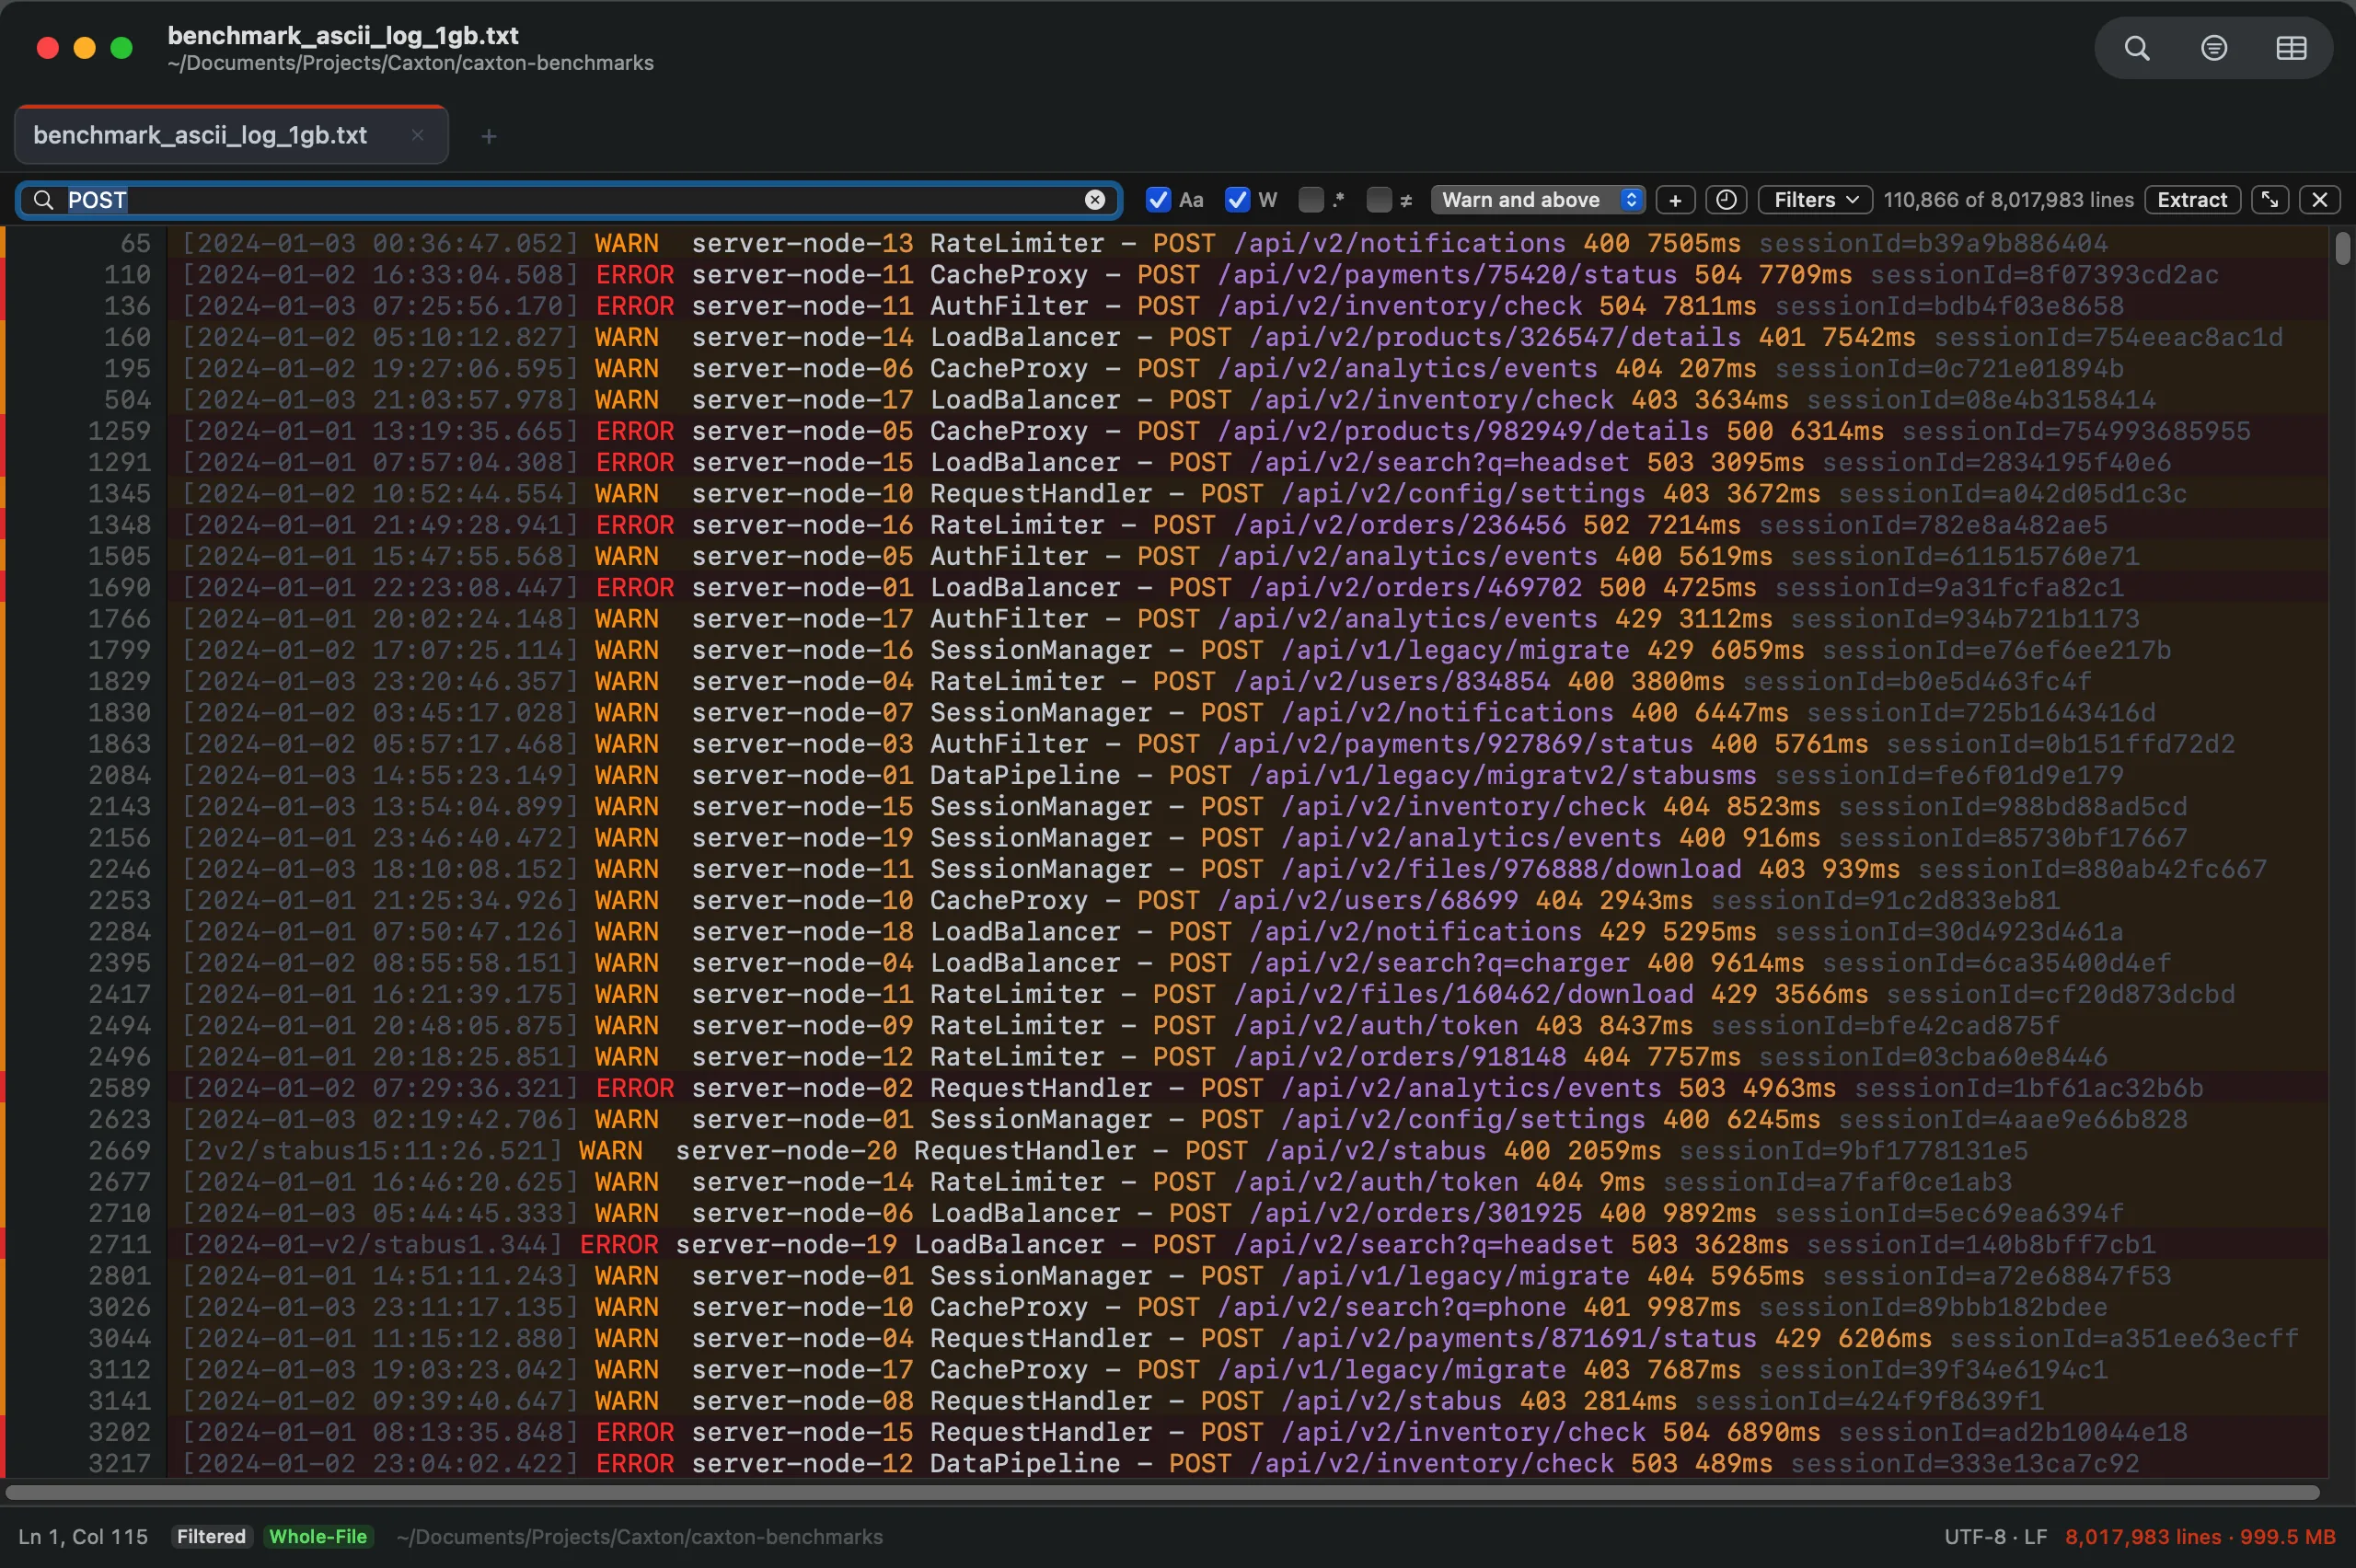
Severity tint on the rows, the same vocabulary driving the filter bar's Severity popup.
Go to Time
⌥⌘L opens Go to Time. In a log whose lines start with a timestamp, the field takes a clock time (14:03, 14:03:30), a date and time (2026-09-04 14:03), a bare date, or an offset from the caret line (+5m, -30s, +2h, +1d). It lands on the first line at or after that time, and the banner names the line and time it landed on. The search probes a few dozen lines through the index, so it does not scan the file.
- Typed times are read in the log's own zone when its lines carry one (
Z,UTC,GMT, an offset such as+05:00, or a named zone with an offset such asGMT+02:00), otherwise in the zone chosen in Timestamp Format. - The banner says so when the log is not in time order near the landing. A continuation line deep in a stack trace keys to its own record.
- An entry that does not parse is named in the banner instead of closing silently. An offset with no unit (
+5) is refused with a hint, rather than being read as a line number.
Timestamp formats recognized
ISO 8601, syslog, Apache access and error logs, nginx error logs, Go's log package, Unix epoch in seconds or milliseconds, and slash-dated forms. Caxton votes the format from the first lines, among the lines it recognizes, so a log whose records span several lines still detects. Day-first dates win when any sampled line proves them, and syslog years roll per line across New Year.
View ▸ Log ▸ Timestamp Format… overrides the vote, the zone for lines that carry none, and the year syslog lines lack. The choice is kept with the session.
Severity filter and tint
The filter bar's Severity popup (Warn and above, Error and above, Fatal only, and the rest) is a gate over every other condition, OR joiners included, and the digest says so. Any row in the Filter Lines panel can match by level instead of text, and the panel also takes time window rows, From and To, in the Go to Time forms.
- One vocabulary drives the row tint, the minimap ticks, the filter, and the Bookmarks panel: ERROR, WARN, INFO, DEBUG, FATAL and their relatives, including bracketed levels,
level=ERROR, and JSON logs. - View ▸ Log ▸ Severity Patterns… adds your own words or regexes with a level each. They are tried top to bottom, the first match wins, and they win over the built-in words.
- A line with no level word and no timestamp follows the record above it, up to 4,096 lines or 1 MB back, so Error and above keeps the stack trace under its error line.
- A slow pattern pauses regex patterns for ten seconds instead of stalling scrolling; literals and built-in words keep classifying.
Notes on bookmarks and the Bookmarks panel
Edit ▸ Bookmarks ▸ Add Note to Bookmark… puts a note on the caret line, bookmarking it first if needed. A noted bookmark shows as a ring in the gutter, and hovering the ring shows the note. Notes move with their line, go when it goes, persist within seconds of a change, and survive relaunch.
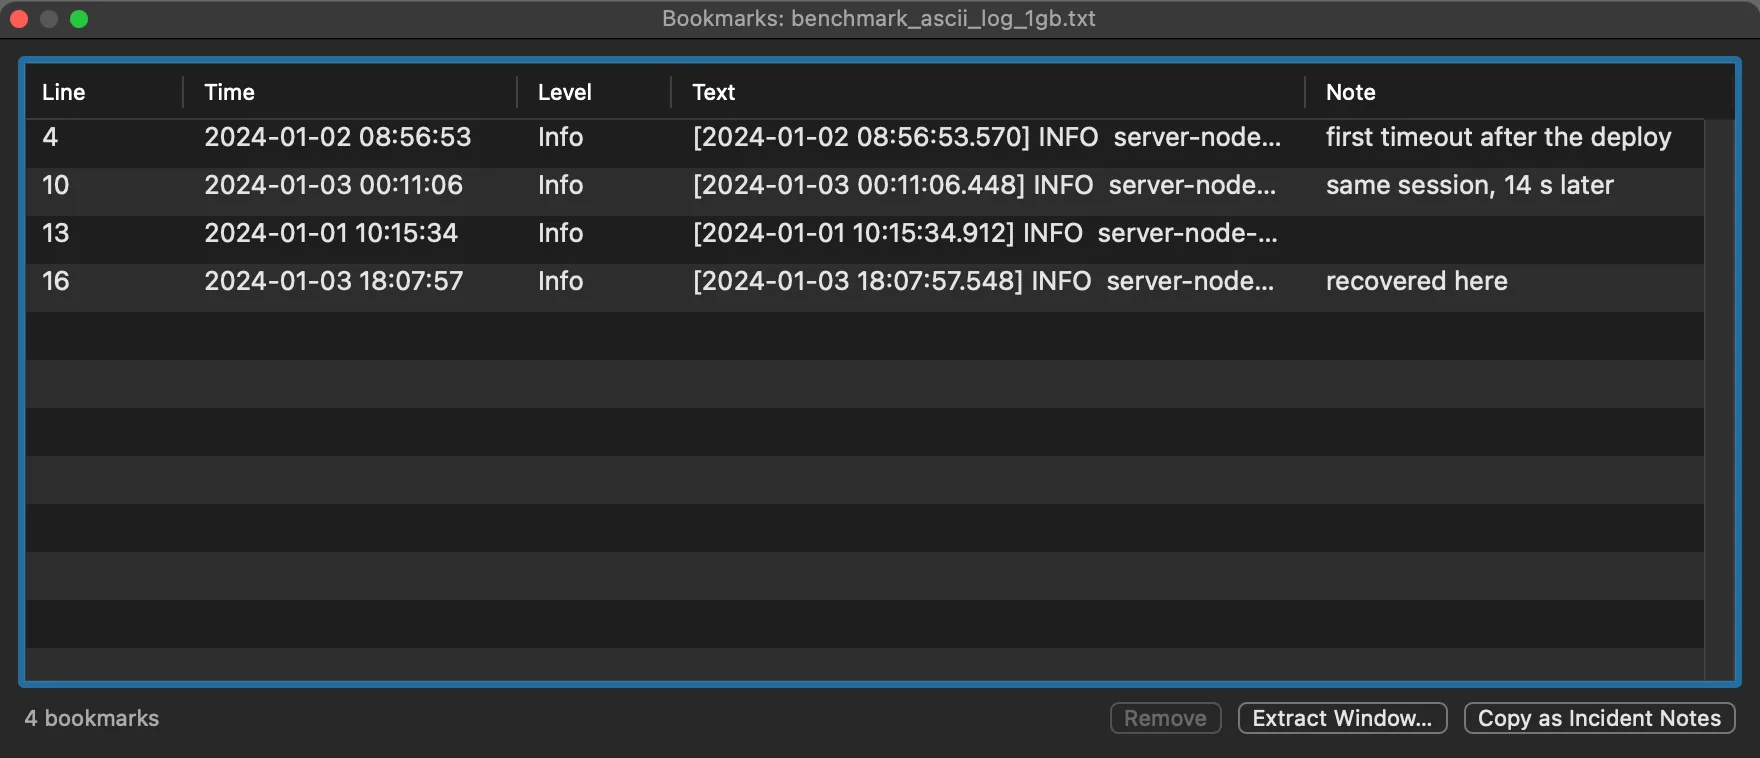
The Bookmarks panel: time and level from the log, the line's text, and a note you can edit in place.
The Bookmarks panel (⌥⌘M) lists every bookmark with its timestamp and severity in a log, its first line of text, and its note, editable in place. Double-click navigates. Copy as Incident Notes puts the table on the clipboard as plain text for a ticket.
Extract Incident Window
Extract Incident Window… takes the lines around every bookmark: N lines before and after, or in a timestamped log N seconds before and after by record time. Overlapping windows merge, and the result is a new document with a header naming each block's source span. With no bookmarks it works around the caret line. It works on a followed log, and refuses only when the document was edited in Caxton while the dialog was open.
Following, Catch Up to Live, and honest lag
In tail mode, Follow pins the view to the end of a growing file, with search, filters, and full scrollback. Follow starts exactly where the file was loaded, so bytes written between the load and the first poll are shown once.
- Behind by how much. When a file grows faster than one poll absorbs, the Following pill says how far behind it is, and the read size adapts to what a tick can take.
- Catch Up to Live. Past half a gigabyte of backlog Caxton reloads the last 64 MB and names the byte range it skipped. View ▸ Log ▸ Catch Up to Live does the same on demand. With unsaved edits it asks first, and the automatic catch-up pauses Follow instead of discarding them.
- The skipped range stays reachable. View ▸ Log ▸ Open Skipped Range as Slice opens the bytes a Catch Up left outside the window in their own window.
- Rotation. When a followed file is rotated, the follower finishes reading the old file, shows the rotation prompt naming any unread bytes, and starts fresh on the new file. No byte of the old file lands in the new one.
- Nothing dropped silently. A read error pauses Follow with the reason, and a Catch Up that cannot reload leaves the follower where it was and says so.
- Follow works on files reopened in another encoding; appended bytes are transcoded as they arrive. On those files the automatic catch-up is off and the menu item is the way.
Related: Navigation & Bookmarks for bookmarks and Go To, Filtering for conditions and presets, Opening Large Files for tail mode.